


MedCalc - 医学统计软件
MedCalc软件是为医学工作者设计的医学计算器,功能齐全。它可以帮助医生作出普通的医学计算,从而对症下药。提供超过76种常用的规则和方法,:病人数据、单位参数、费用计算等等。它易于学习,且可靠,并且包括220多种统计测试,过程和图形。
MedCalc是用于生物医学研究的统计软件包,易学,可靠。
√超过220个统计测试,程序和图表
-ROC曲线分析参考软件
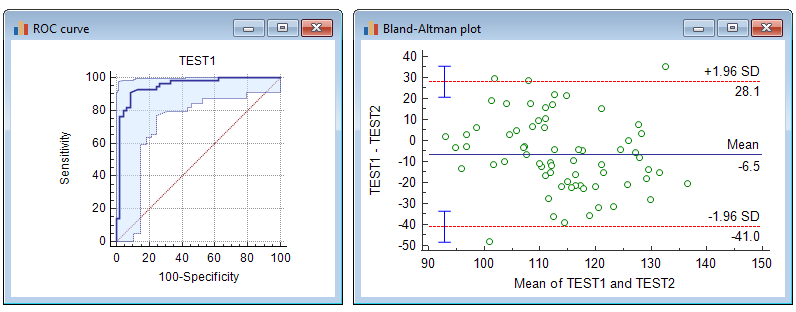
-方法比较和方法评估,包括Bland&Altamn图,Passing&Bablok和Deming回归
-参考区间,包括与年龄相关的参考区间
-Kaplan-Meier生存分析和Cox比例风险回归
-荟萃分析
√将图形保存为SVG,PNG,JPG,高分辨率TIF或文件格式,或保存为PowerPoint幻灯片(*.pptx)
√提供英语,中文(简体和繁体),法语,德语,意大利语,日语,韩语,波兰语,葡萄牙语(巴西),俄语,西班牙语用户界面(帮助文件和文档为英文)
√一个版本包含全部功能
√与现代Windows桌面版本兼容
MedCalc功能
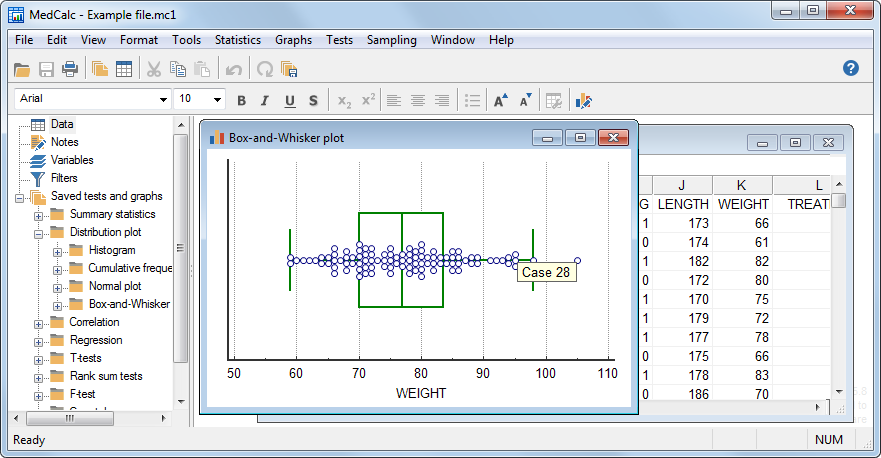
数据管理
-
具有1048576行和16384列的电子表格
-
正确处理丢失数据
-
异常值可以排除
-
内置所见即所得的文本编辑器
-
导入Excel,Excel 2007,SPSS,DBase和Lotus文件,以及SYLK,DIF或纯文本格式的文件
-
易于选择子组进行统计分析
MedCalc文档
-
详尽的上下文相关帮助
-
MedCalc网站上的的HTML手册
-
对话框中的上下文帮助
ROC曲线分析
MedCalc是用于ROC曲线分析的参考软件。ROC曲线分析模块包括:
-
具有标准误差,95%置信区间和p值的曲线下面积(AUC)。提供DeLong等人的方法之间的选择(1988)和Hanley&McNeil(1982,1983)
-
列出可能阈值的敏感性,特异性(specificity),似然比和正和负的预测值
-
具有95%置信区间的ROC曲线图
-
阈值可以交互式点图中选择,并自动计算相应的灵敏度和特异性
-
敏感性和特异性或成本与标准值的关系图
-
预测值与患病率的关系图
-
区间似然比
-
至多可比较6条ROC曲线:ROC曲线下面积之间的差异,具有标准误,95%置信区间和p值
-
ROC曲线下面积的样本大小计算和ROC曲线比较
图形
-
大量的图形
-
在图形中的数据点识别
-
绘制文本框,线条,箭头和连接器
-
命名,保存和重新创建图形和统计信息
-
在图形窗口中的统计信息
-
将图形保存为SVG,PNG,JPG,GIF,BMP,PCX或高分辨率TIF文件,或另存为PowerPoint幻灯片(*.pptx)
系统要求
-
带有Windows Vista,Windows 7、8、8.1、10或11的PC;或Windows Server 2008或更新版本(支持32位和64位版本)。
-
在Windows 8之前的Windows版本上,对Excel* .xlsx文件的支持还需要Microsoft .NET Framework 4.0
-
2048MB的内存
-
硬盘上60MB的可用空间
MedCalc常见问题:
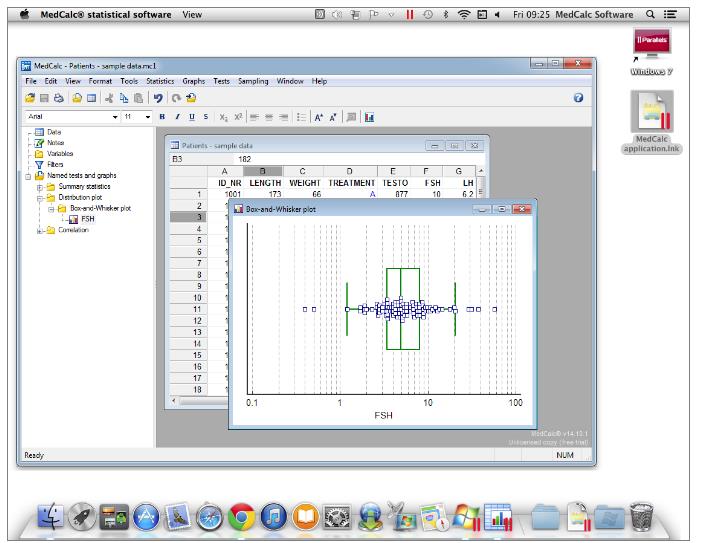
1、MedCalc有Mac版本吗
没有Mac版本。
您可以通过以下技术在Mac上运行MedCalc:
Boot Camp:这是Mac随附的实用程序,可让您在macOS和Windows之间切换。
Parallels Desktop for Mac等虚拟化软件(见下图)。这样可以更好地集成MedCalc和Mac上的其他应用程序。
2、在MedCalc中,您可以为用户界面和输出选择不同的语言。
用户界面:菜单、对话框和其他用户界面元素中使用的语言。
输出:报告和图表中使用的语言。
可用语言有:英语、中文(简体和繁体)、法语、德语、意大利语、日语、韩语、波兰语、葡萄牙语(巴西)、俄语和西班牙语。要选择其他语言,请转到工具菜单 ➔ 选项,您可以在语言部分中选择您的语言。帮助文件和软件文档仅提供英文版本。
【英文介绍】
Data management
Integrated spreadsheet with 1 048 576 rows and 16 384 columns.
Correct handling of missing data.
Outliers can easily be excluded.
Built-in WYSIWYG text editor.
Imports Excel, Excel 2007, SPSS, DBase and Lotus files, and files in SYLK, DIF or plain text format.
Easy selection of subgroups for statistical analysis.
MedCalc Documentation
Comprehensive help file.
Manual in PDF format (go to download area).
Complete HTML manual on MedCalc web site.
Context help in dialog boxes.
Statistical features
See list of statistical procedures.
ROC curve analysis
MedCalc is the reference software for ROC curve analysis. Our ROC curve analysis module includes:
Area under the curve (AUC) with standard error, 95% confidence interval, P-value. Offers choice between methodology of DeLong et al. (1988) and Hanley & McNeil (1982, 1983).
List of sensitivity, specificity, likelihood ratios, and positive and negative predictive values for all possible threshold values.
ROC curve graph with 95% Confidence Bounds.
Threshold values can be selected in an interactive dot diagram with automatic calculation of corresponding sensitivity and specificity.
Plot of sensitivity and specificity, or cost, versus criterion values.
Plot of predictive values versus prevalence.
Interval likelihood ratios.
Comparison of up to 6 ROC curves: difference between the areas under the ROC curves, with standard error, 95% confidence interval and P-value.
Sample size calculation for area under ROC curve and comparison of ROC curves.
Go to the ROC curve analysis section of the MedCalc manual for more information on ROC curve analysis in MedCalc.
Graphs
Lots of graphs, see Graph gallery.
Data point identification in graphs.
Draw text boxes, lines, arrows and connectors.
Name, save and recall graphs and statistics.
Statistical info in graph windows.
Save graphs as BMP, PNG, GIF, PCX, JPG or TIF files, or as PowerPoint slides (*.pptx).


- 2026-07-21
- 2026-07-15
- 2026-07-15
- 2026-07-03
- 2026-06-30
- 2026-06-25

- 2026-07-21
- 2026-07-16
- 2026-07-15
- 2026-07-15
- 2026-07-15
- 2026-07-15