Chemometrics Toolbox - 化学计量学工具箱
Chemometrics Toolbox 提供了 70 多种用于化学计量校准的专用 MATLAB 函数。它使您能够使用方法(例如潜在变量中的多元线性回归、主成分回归和偏小二乘法)执行定量和定性分析。化学计量学将数据组织成矩形,以便对齐进行处理以创建校准或提取有用信息。这使得MATLAB成为化学计量学的理想环境。
Chemometrics Toolbox 提供化学家、生物学家、科学家和工程师开发和验证与复杂过程分析仪和实验室仪器一起使用的校准所需的全面功能。Chemometrics Toolbox 旨在提高生产力,提供的工具使用户能够快速轻松地将化学计量技术应用于数据,使他们能够对其应用进行定量和定性分析,同时保持对数学的信心。
为了简化校准的工业部署并减少与版本相关的维护问题,Chemometrics Toolbox与在平台上运行的 MATLAB 版本保持兼容。有些人成功地将Chemometrics Toolbox与 Octave 结合使用,这是一个开源 MATLAB 克隆,可使用。
特征
-
超过 70 种专门的化学计量学功能
-
经典小二乘法 (K-matrix) 多元线性回归
-
逆小二乘法 (P-matrix) 多元线性回归
-
主成分分析(PCA 或因子分析)
-
主成分回归 (PCR)
-
偏小二乘法 (PLS)
-
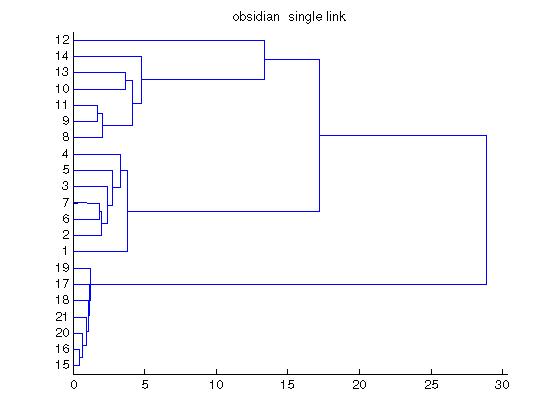
聚类分析
-
用于基于因子的方法的模型制定的指标函数
-
绘图和可视化功能
-
逐键入门教程
重点介绍
多元线性回归 (MLR) 技术。化学计量学工具箱包括用于生成定量校准的核心程序。主要功能包括:经典小二乘法(CLS 或 K 矩阵)、逆小二乘法(ILS 或 P 矩阵)和 Q 矩阵方法。
基于因素的技术。该工具箱包括基于因子的方法,用于生成定量校准和获得对数据的定性洞察。主要功能包括:主成分分析(PCA 或因子分析)、主成分回归 (PCR)、偏小二乘法 (PLS) 和 PLS 回归矩阵(无需迭代 PLS 预测)。
指标功能。 包含指标函数系列,以帮助在使用基于因子的技术时制定正确的模型:减少特征值指标、减少特征值的双向 F 检验、拟合训练数据、拟合验证数据、分数指标函数、交叉验证和预测残差平方和 (PRESS)。
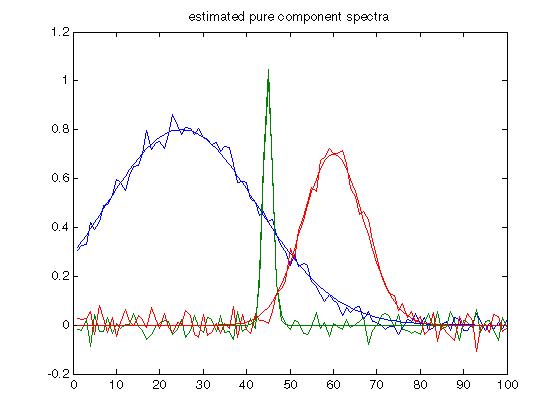
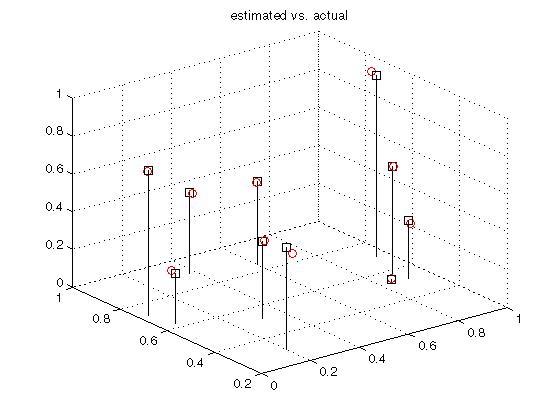
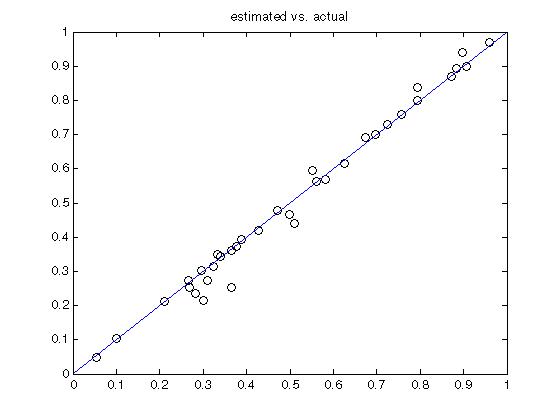
绘图。多个绘图命令可以轻松查看数据和发现模式,例如在单个图形中绘制多达四个统计指标函数,以及绘制分数与分数以使用基于因子的技术可视化数据集群。
【英文介绍】
The Chemometrics Toolbox provides more than 70 specialized MATLAB functions for chemometric calibration. It enables you to perform quantitative and qualitative analysis using powerful methods such as Multiple Linear Regression, Principal Component Regression, and Partial Least-Squares in latent variables. Chemometrics organizes chemical data into matrices so that it can be processed to create calibrations or extract useful information. This makes MATLAB an ideal environment for chemometrics.
The Chemometrics Toolbox provides a comprehensive array of the functions needed by chemists, biologists, scientists, and engineers to develop and validate calibrations used with sophisticated process analyzers and laboratory instruments. Designed to enhance productivity, the Chemometrics Toolbox provides the tools that enable users to quickly and easily apply chemometric techniques to data, allowing them to perform quantitative and qualitative analysis on their applications while maintaining confidence in the math.
In order to simplify industrial deployment of calibrations and to eliminate version-related maintenance issues, the Chemometrics Toolbox remains compatible with all versions of MATLAB running on all platforms. Some people are successfully using the Chemometrics Toolbox with Octave, an Open Source MATLAB clone which is available at no charge.
Features
-
More than 70 specialized chemometrics functions
-
Classical Least-Squares (K-matrix) multiple linear regression
-
Inverse Least-Squares (P-matrix) multiple linear regression
-
Principal component analysis (PCA or factor analysis)
-
Principal component regression (PCR)
-
Partial least-squares (PLS)
-
Cluster Analysis
-
Indicator functions for model formulation for use with factor-based methods
-
Plotting and visualization functions
-
Keystroke-by-keystroke introductory Tutorial
Highlights
Multiple linear regression (MLR) techniques. The Chemometrics Toolbox includes core routines for producing quantitative calibrations. Primary capabilities include: classical least-squares (CLS or K-matrix), inverse least-squares (ILS or P-matrix), and Q-matrix methods.
Factor-based techniques. The toolbox includes factor-based methods for producing quantitative calibrations and for gaining qualitative insight into data. Key functions include: principal component analysis (PCA or factor analysis), principal component regression (PCR), partial least-squares (PLS), and PLS regression matrix (eliminating the need for iterative PLS prediction).
Indicator functions. A complete family of indicator functions are included to assist in formulating the correct models when using factor-based techniques: reduced eigenvalues indicator, two-way F-test for reduced eigenvalues, fit to training data, fit to validation data, fractional indicator function, cross-validation, and predicted residual error sum-of-squares (PRESS).
Plotting. Several plotting commands make it easy to view data and spot patterns, such as plotting up to four statistical indicator functions in a single figure, and plotting scores vs. scores to visualize data clusters with factor-based techniques.
Tutorial. The introductory tutorial included in the user's guide quickly teaches you how to use the toolbox by leading you keystroke-by- keystroke through the toolbox functions.
- 2026-02-09
- 2026-01-20
- 2026-01-16
- 2026-01-12
- 2026-01-12
- 2026-01-09
- 2026-02-05
- 2026-02-05
- 2026-01-28
- 2026-01-26
- 2026-01-26
- 2026-01-16


