Stat-200 - 数据统计软件
注:特此通知,BIOSOFT将于2022年12月31日停止交易。
电子邮件地址info@biosoft.com将在该日期后的2年内继续有效,以便向软件的注册用户提供程序激活代码和少量技术支持。
Stat - 200是综合的统计数据包。它的客户在处理,分析和呈现数据所需描述性统计,参数和非参数统计测试,图形和数据转换。Stat -200中的参数测试和程序总共60个,有66个非参数测试和程序以及30个不同的描述性统计。
ANOVAN因子分析。不寻常的程序,例如,生存分析。测试有相关的信息窗口,提供文献参考和事实,以帮助获得正确的工作。概率是直接计算的,因此要使用表格。

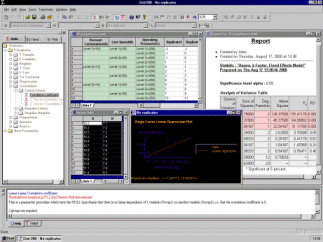
Stat-200用户界面,其统计和绘图模块都可以从逻辑树视图中选择。您经常使用的程序可以放在收藏夹列表中以便即时访问。工作簿是操作和选择数据的工具。它可以是大小,受您的计算机硬件限制。提供了65种数据转换,并且内置了高等语言,以便用户可以对转换进行编程。数据可以键入,也可以电子表格中复制,粘贴或拖放。此外,可以直接打开多种格式的电子表格文件。Stat-200很与数据库,它ODBC数据库连接的Recordset表,使数据和结果可以的来回传递。
Stat-200中的图形类型统计数据的常用类型,如线条,饼图,条形图,散点图和盒须图以及3D绘图选项。提供多种线图样式,拟合多项式,对数,指数和幂函数以及移动平均线图,以及原始数据,均值和数据频率图,此外还可以自动绘制图形类型,如Kaplan-Meier , Weibull , Pareto , Shewart , Polar等。
测试的数字结果可以直接从Stat-200打印或复制到剪切板或保存以导入程序中。图形可以直接打印或保存,也可以导出为Windows位图或Windows图元文件。通过HTML的可选输出结果以及.JPG和.PNG文件格式的图形结果,增强了与Web的。
Stat-200的统计功能模块作为OCX提供,可以嵌入到网页或脚本语言中,这为将统计分析作为类型醒目的一部分纳入了很大的空间。
英文简介:
Stat-200 is a remarkably comprehensive general statistics package. It incorporates all the descriptive statistics, parametric and non-parametric statistical tests. graphics and data transforms you will need for processing, analyzing and presenting data. Parametric tests and procedures in Stat-200 total 60 and there are 66 non-parametric tests and procedures and 30 different descriptive statistics. ANOVA is comprehensive and includes general N factor analysis. Many unusual procedures are included e.g. survival analysis. All tests have associated information windows which give literature references and other facts to assist in getting the right one for the job. Probabilities are calculated directly so there is no need to use tables.
Stat-200 has a state-of-the-art user interface with all its statistical and plotting modules easily selected from the logical tree views. Procedures you use frequently can be placed in a Favorites list for instant access. The workbook is a powerful tool for manipulating and selecting data. It can be any size, limited only by your computer hardware. More than 65 data transforms are supplied and there is a high-level language built-in to enable any transform to be programmed by the user. Data can be keyed-in and also either copied and pasted or dragged and dropped from spreadsheets. In addition, spreadsheet files in many formats can be directly opened. Stat-200 is readily integrated with databases and it supports Recordset tables for ODBC database connections enabling data and results to be easily passed back and forth.
Graph types in Stat-200 include all the usual types for statistical data such as line, pie ,bar, scatter and box-whisker charts together with 3D plotting options. A wide variety of line graph styles is available including fits to polynomial, logarithmic, exponential and power functions and plots of moving averages, as well as graphs of raw data, means and data frequencies. In addition, many specialized graph types such as Kaplan-Meier, Weibull, Pareto, Shewart, Polar ect can be plotted automatically. Templates of frequently used graph styles can be created and saved.
Numeric results of tests can be printed direct from Stat-200 or copied to the clipboard or saved for import into other programs. Graphs can be printed or saved and saved and also exported as Windows Bitmaps or Windows Metafiles. Integration with the Web is enhanced by optional output of text in HTML and graphical results in JPG and PNG file formats.
Stat-200 Features
Descriptive Stats
-
Arithmetic mean
-
Standard deviation(n-1)
-
Standard deviation(n)
-
Standard error
-
Skewness
-
Kurtosis
-
95% confidence limit for mean
-
99% confidence limit for mean
-
Min value
-
Max value
-
Sample range
-
Number of samples
-
Median
-
Sx
-
Sx2
-
Geometric mean
-
Variance
-
Average deviation
-
Angular Descriptive Stats
-
Cosine mean
-
Sine Mean
-
Mean vector length
-
Mean angle Cosine
-
Mean angle Sine
-
Mean angle Tan
-
Mean angle
-
Circular variance
-
Angular variance
-
Angular deviation
-
Circular standard deviation
Nonparametric Tests
-
N×K Chi-squared
-
2×2 Chi-squared
-
Fisher's exact test
-
McNemar's test
-
One-sample chi-squared
-
Cramer's V
-
Contingency coefficient
-
Wilcoxon's matched pairs
-
Mann-Whitney U-Test
-
Friedmann's test
-
Kruskal-Wallis test
-
Spearman rank correlation
-
Kendall rank correlation
-
Kendall partial rank correlation
-
Kendall coefficient of concordance
-
LogRank test
-
Mantel Haenszel test
-
Kolmogorov-Smirnov test
-
Phi-coefficient for 2×2 tables
-
Cramer coefficient C
-
Median test
-
Extension of the median test
-
Robust rank order test
-
Siegel-Tukey test for scale differences
-
Moses rank-like test for scale differences
-
Cochran Q-test
-
Jonckheere test for ordered alternatives
-
Page test for ordered alternatives
-
Chi-squqre test for k indeoendent samples
-
Kendall coefficient of agreement samples
-
Kappa statistic for nominally scaled data
-
Gamma statistic for orded variables
-
Lambda statistic for asymmetrical association
-
Somers d for asymmetrical associatio of ordered variables
-
Cox'sF-test
-
Fisher's cumulant test for normality of a distribution
-
F-test for two counts(Poisson distribution)
-
Wilcoxon inversion(U)test
-
Median test of two populations
-
Median test of k populations
-
The-Siegal-Tukey rank sum disperion test of two variances
-
Steel test for comparing K treatments with a control
-
Sequential test for a populatiob mean
-
Sequential test for a standard deviation
-
Adjacency test for randomness of fluctuations
-
Serial correlation test for randpmness of fluctuations
-
Turning point test for randomness of fluctuations
-
The difference sign test for randomness in a sample
-
Run-test on successive differences foe randomness in a sample
-
Run-test for randomness of two related samples
-
Run-test for randomness in a sample
-
Wilcoxon-Mann-Whitney rank sum test for randomness of signs
-
Friedmann's test for multiple treatment of a series of subjects
-
Rank correlation test for agreement in multiple judgements
-
Test the equslity of multinomial distributions
-
Bowker test foe nominal-scale data
-
Lehmacher test for variables with more than 2 categories
-
Fisher contingency table test for variables with more than two categories
-
Gehan test for censored data
-
Fisher-Pitman randomizatiob test for interval -scale data
-
Pitman-Welch test for interval scale data
-
Wall test for nominal scale data
-
Pitman randomization test for inteval scale data
-
Angular-angular correlation
-
Watson U2 test(To test whether two samples from circular observations dffer significantly from each other, regarding mean direction or angular variance )
-
Watson-Willams test(to test whether the mean angles of two independent circular observations differ significantly from each other)
Graphics
-
PIE chart
-
Bar chart
-
Area graph
-
Line graph
-
Scatter graph
-
Box-whisker graph
-
3D surface graph
-
Bubble charts
-
Polar charts
-
Radar charts
-
Polynomial regression plot
-
Pareto chart option in frequency analysis plots
-
Kaplan-Meier survival curves
-
Density function plots and cumulative probability plots for Gaussian(Normal)distribution, lognormal distribution, Weibull distribution, gamma distribution, Poisson distribution, beta distribution and chi-square distribution
-
Regression plots direct from raw data(single factor, single factor repeated measures)
-
Polynomial regression plots
-
One-factor response curves and two-factor response surface plots(1st and 2nd order)
-
Minimun spanning tree plots for 2 dimensions
-
Levey-Jennings/shewart Charts
-
Sequential test for a population mean
-
Sequential test for a standard deviation classification
-
c-chart
-
X-chart
-
R-chart
Parametric Tests
-
Frequency analysis
-
Unpaired t-test
-
Paired t-test
-
Unequal variance test
-
Bonferroni t-test
-
One-way non-repeated ANOVA
-
One-way replicated ANOVA
-
Two-way replicated ANOVA
-
Two-way repeated ANOVA
-
Three-way ANOVA
-
Linear regression
-
Multiple linear regression
-
Compare two observed values
-
Compare 2 sample proportios
-
Compare sample and population
-
Compare paired proportions
-
Bartlett's test
-
Dunnett's test
-
Duncan's test
-
Tukey's test
-
General N factor ANOVA for multiple fixed effects factors
-
2k factorial design for k=2,3
-
Durbin-Watson test(residual auto correlation test)
-
Single calssification ANCOVA for completely randomized design
-
Pearson R
-
Repeated measures linear regrassion
-
Backward elimination for multiple linear regression
-
Polynomial regression
-
Tigonometric regression
-
Linear-linear regression
-
Angular-angular correlation
-
Angular-linear correlation
-
Rayleigh test determine if oberved samples of angular data have a tendency to cluster around a given angle indicating a lack of randomness of the distribution)
-
Single Factor analysis of variance of variance foe angular data
-
Link-Wallace test for multiple com-parisons of k population means
-
Hotelling's T-square test for two series of population means
-
Dixon test for outliers
-
F-test for the overall mean of K subpopulations(ANOVA)
-
F-test for multiple comparisons of contrasts between K population means
-
F-test for K population means(ANOVA)
-
Z-test of a correlation coefficient
-
Z-test of 2 correlation coefficients
-
t-test of a correlation coefficient
-
Hartley's test for equality of K variances
-
Fisher cumulant test for normality of a distribution
-
F-test for correlated proportions
-
Z-test for correlated proportions
-
The w/s test for normality of a population
-
Cochran test for variance outliers
-
Chi-square test for compatibility of K counts
-
Cochran test for consistency in an nxk table of dichotomous data
-
Chi-square test for consistency in a 2xk table
-
Chi-square test for independence in a pxq table
-
Sign test for a median
-
Sign test for two medians(paired observations)
-
Sign rank test for a mean
-
Sign rank test for two mean(paired observations)
-
Mardia-Watson-Wheeler test(to test whether two independent random samples from circular observations differ significantly from each other ragarding mean angle, angular variance or both)
Data Trabsforms
-
Polynomial
-
Reciprocal
-
Natural Log
-
Log10
-
Log2
-
Ln(x+1)
-
Exp(x)
-
Square Root
-
Cube Root
-
Xn
-
Sin
-
Cos
-
Tan
-
Sort Ascending
-
Sort Descending
-
Rank Ascending
-
Rank Descending
-
Modulo
-
Absolte Value
-
Standardize
-
Center
-
Multiply columns
-
Divide columns
-
Add columns
-
Subtract columns
-
Error Function
-
Complementary error function
-
Logit
-
Probit
-
Normit
-
Normal probabilites
-
Student's probabilities
-
F distribution probabilities
-
Chi-Squared probabilities
-
Transform by a spreadsheet formula
-
Matrix operations: inverse matrix, transpose Matrix
-
Sinh
-
Cosh
-
Tanh
-
aSin
-
aCos
-
aTan
-
Bessel functions of first and second kind
-
Conversions
-
Integer ceiling, floor
-
Powerful language to program user-defined transforms
Miscellaneous
-
Generate uniformly distributed random numbers
-
Generate normal randomly distributed numbers
-
Generate Poisson randomly distributed numbers
-
Generate exponentially distributed numbers
-
Generate gamma randomly distributed numbers
-
Fill range with arithmetic sequence
-
Fill range with geometric sequence
-
Fill range with constant
-
Kolmogorov-Smirnoff test for goodness of fit(to investigate the difference between an observed distribution and a specified population distribution)
Quality control
-
The sequential test for a dichotomous classification
-
Quality control acceptance sampling
- 2026-02-09
- 2026-01-20
- 2026-01-16
- 2026-01-12
- 2026-01-12
- 2026-01-09
- 2026-02-05
- 2026-02-05
- 2026-01-28
- 2026-01-26
- 2026-01-26
- 2026-01-16


